
A Tsunami of Savings
A big hoard of cash savings is about to be unleashed on the markets.

2020 was one of those years statisticians and economists like to call ‘an Anomaly’. Millions of people all over the world lost their jobs and got laid off temporarily as the global economy nosedived into one of the greatest recessions ever. The biggest component of a GDP, private consumption or spending, plunged as we were confined to our sofas binge watching TV shows and honing our gambling skills on Robinhood.
Private consumption goes hand in hand with Personal or Household income which, in a doomsday 2020 scenario felt the brunt of the impact for most people. The other half of Household income – Personal Savings, tends to move in the other direction in a period like this.
Household income could be disaggregated into something like this:
Gross income = Spending/Consumption + Personal Savings
When the future looks bright and sunny and we feel secure about our jobs and careers, we have both more willingness and more ability to spend. In a year like 2020 or 2008 when all you see is a sea of uncertainty and pessimistic forecasts, you cannot expect neither. But last year was slightly different than a normal recessionary year. We were forced to be confined to our homes, businesses were forced to shut down, there was no entertainment, no shopping, no bars and no travel. Even if we had the ability to and were willing to, we couldn’t follow our traditional spending pattern. And that certainly showed up the economic data released in different regions of the world.
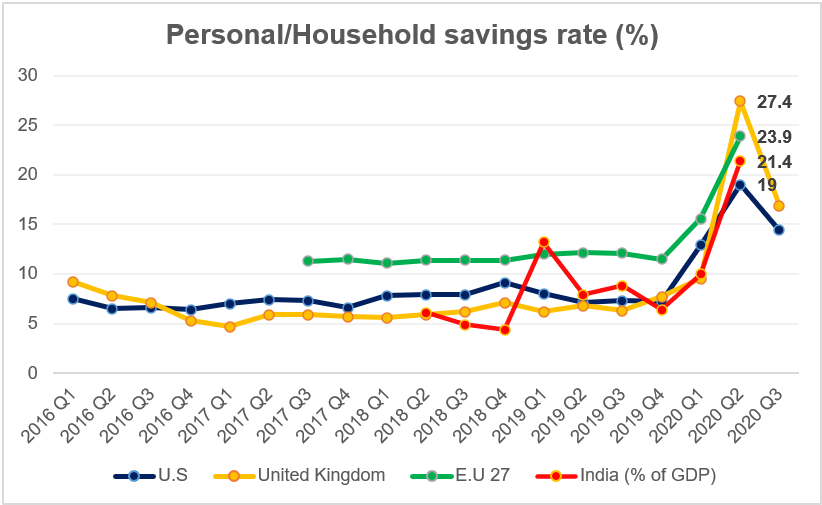
**Note: Savings rates in these geographies have had different base rates historically along with assets these savings reside in. A majority of the savings in the U.S are a part of retirement accounts and pension funds (invested in the market) whereas savings in India have predominately used physical assets, bank deposits and insurance products for instance.
Personal/Household savings rates, measured by the percentage of disposable income saved (and not spent) jumped by multiple percentage points in the U.S, UK and EU whereas savings as a percentage of GDP in India spiked to 21.4%! These numbers obviously include the impact of reduced incomes, monetary deposits and different forms of monetary stimulus by central banks and forced cut-off in spending. But this could still have a significant impact on consumption and spending patterns globally. You could already see a new pattern emerging with ecommerce sales sky-rocketing everywhere in different verticals, increased demand of subscription based content and increased grocery spends (with uncomfortably high alcohol sales).

One of the downsides of looking at economic data is that it comes with a lag. And that lag could be big enough to rob the data off its predictive ability (however tiny it may be). And its hard to separate the persistent trends from the fleeting ones. One thing that most of us are not good at is compartmentalising our spends. We usually do not have separate mental accounts for our categorical spends. A cumulative high savings is bound to leak into other verticals we could spend in. Eating/drinking out, travel expenditures leaked into groceries and big-ticket purchases like house refurbishing, phones and electronic gadgets. Discretionary items like luxury goods, cars and expensive wine (including speculative stocks and assets, of course) saw a considerable uptick in Q3 going well into Q4.
With a Tsunami of savings waiting on the side-lines, 2021 could be a massive year for travel, hospitality and entertainment sectors all around the world. Maybe one of the best ever. Domestic travel should be the first to recover as a return to normalcy might take its own time in different countries, followed by the restaurants and recreation. I know people who’ve already started planning their 2021-2022 travel (Buy low…good move sirs). An increasing propensity to spend usually fares well for the markets when all sentiment meters have started to turn green(ish). Does it mean a (long-overdue) rotation into the beaten-down sectors? Would cyclicals make a full-blown comeback? The Vanguard World Consumer Discretionary ETF has been on a tear ever since that 30% drop in March.

Although this has 20% allocation to $AMZN, you take that out and you’re still left with decent returns in a year like 2020.
Its nigh impossible to exactly predict what route this flood of savings will take and how persistent some of these trends would be but all you need is a reasonable estimate and your subjective (very subjective) likelihoods of these estimates, right?
See you next week!
The Atomic Investor